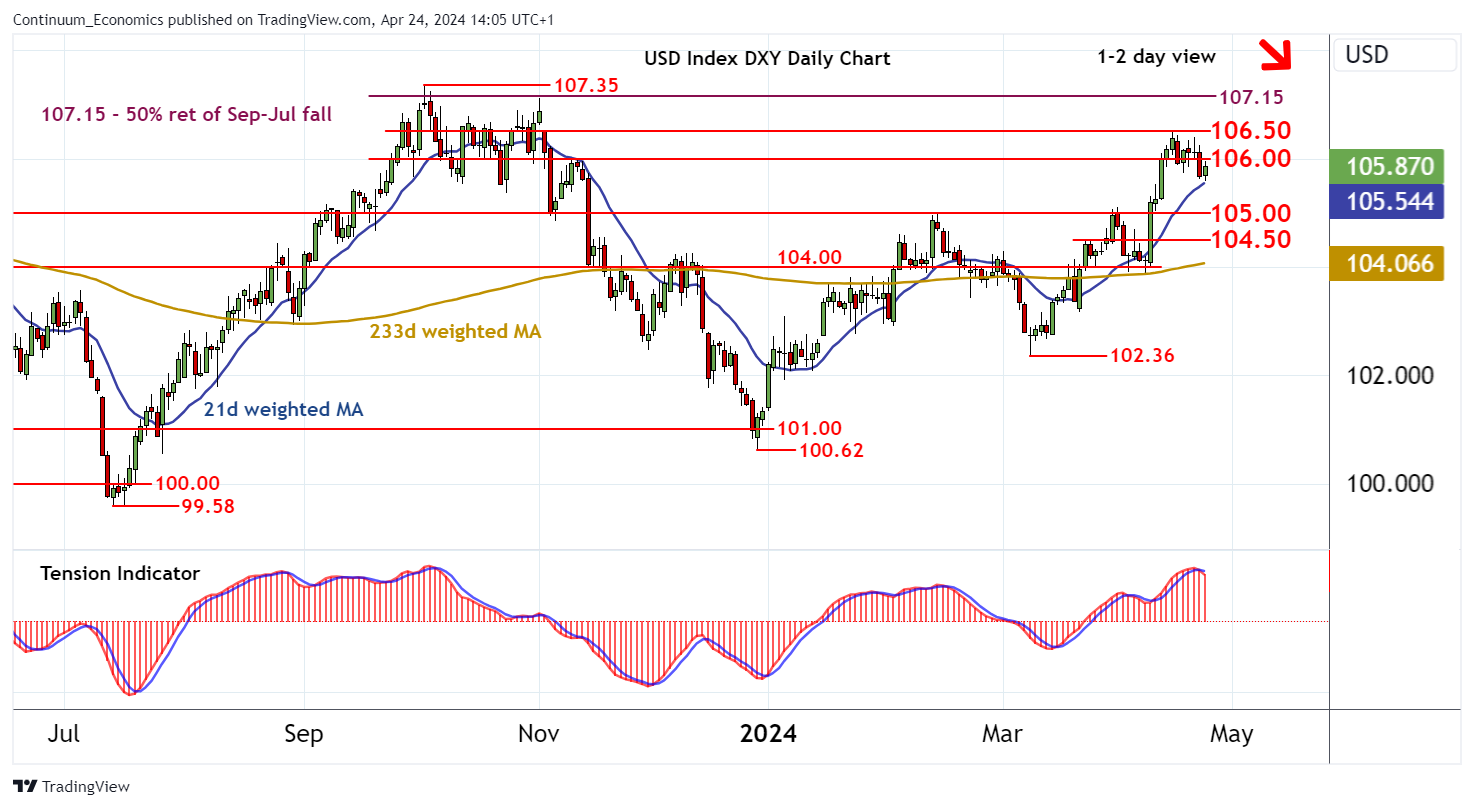
Chart USD Index DXY Update: Leaning lower

The anticipated break below 106.00 has reached 105.59, where unwinding oversold intraday studies are prompting short-term reactions
| Levels | Imp | Comment | Levels | Imp | Comment | |||
|---|---|---|---|---|---|---|---|---|
| R4 | 107.35 | ** | 3 Oct 2023 (y) high | S1 | 105.59 | intraday low | ||
| R3 | 107.15 | ** | 50% ret of Sep-Jul fall | S2 | 105.00 | ** | break level | |
| R2 | 106.50 | * | congestion | S3 | 104.50 | break level | ||
| R1 | 106.00 | * | congestion | S4 | 104.00 | * | congestion |
Asterisk denotes strength of level
13:55 BST - The anticipated break below 106.00 has reached 105.59, where unwinding oversold intraday studies are prompting short-term reactions. Immediate focus is back on 106.00, but negative daily readings and flattening overbought weekly stochastics are expected to limit any tests/break in fresh selling interest. In the coming sessions, further losses are looked for, with focus to turn to support at 105.00. However, the rising weekly Tension Indicator could prompt fresh buying interest around here. Meanwhile, a close back above 106.00 would turn sentiment neutral and give way to consolidation beneath further congestion around 106.50.