Published: 2024-04-24T13:25:45.000Z
Chart USD/JPY Update: Consolidating at 34-year highs

Senior Technical Strategist
1
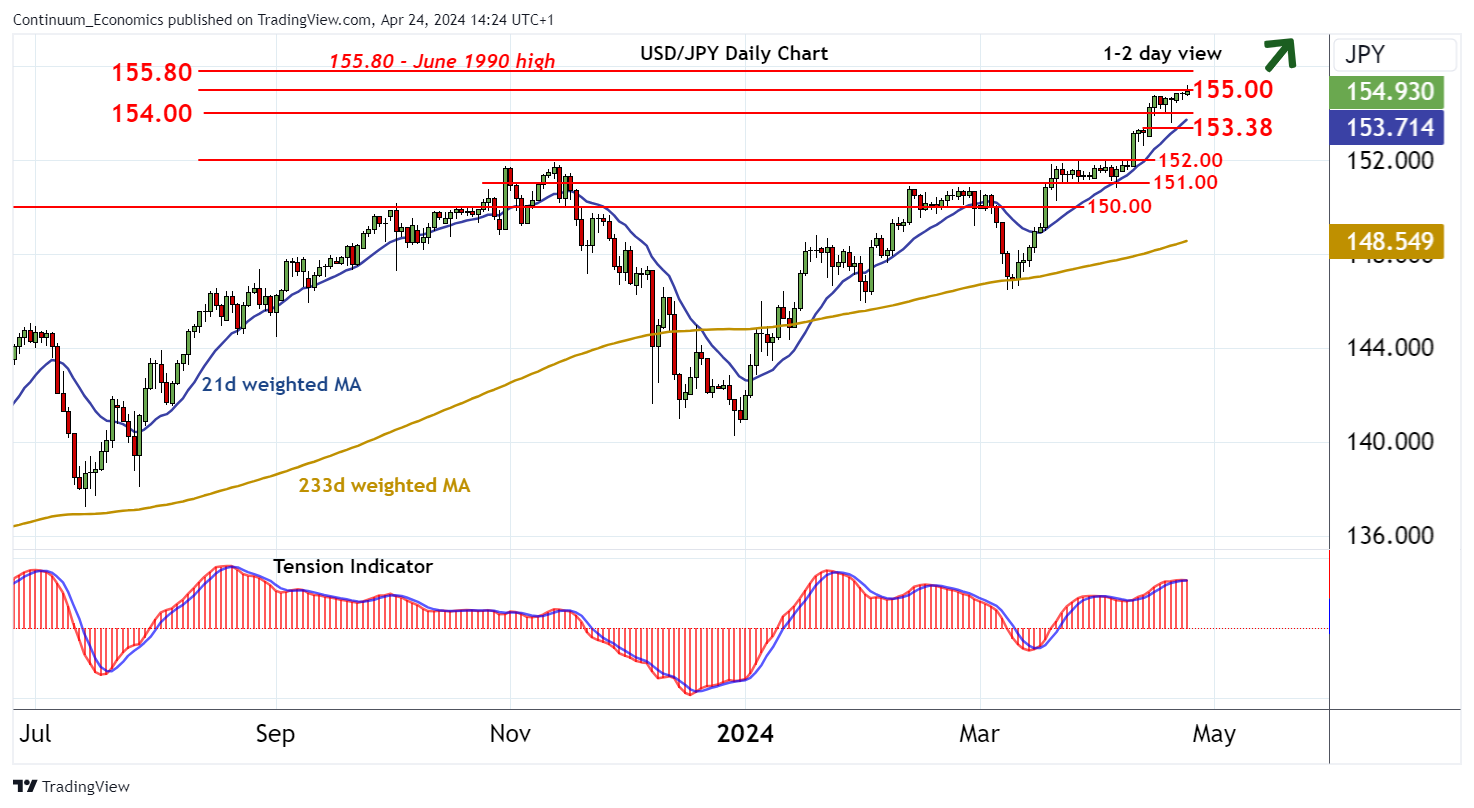
The test of 155.00 has extended to a fresh 34-year high around 155.15
| Levels | Imp | Comment | Levels | Imp | Comment | |||
|---|---|---|---|---|---|---|---|---|
| R4 | 156.00 | figure | S1 | 154.00 | figure | |||
| R3 | 155.80 | ** | June 1990 high | S2 | 153.38 | * | 12 Apr (w) high | |
| R2 | 155.15 | intraday high | S3 | 152.00 | * | break level | ||
| R1 | 155.00 | * | figure | S4 | 151.00 | * | congestion |
Asterisk denotes strength of level
14:25 BST - The test of 155.00 has extended to a fresh 34-year high around 155.15, where mixed intraday studies are prompting fresh reactions. Daily stochastics are flattening in overbought areas and the daily Tension Indicator is also neutral, highlighting a cautious tone. However, broader weekly charts are rising, pointing to potential for further gains in the coming sessions towards the 155.80 high of June 1990. Meanwhile, support remains at 154.00. A close beneath here, if seen, should meet fresh buying interest towards the 153.38 weekly high of 12 April.