Published: 2024-04-24T13:37:24.000Z
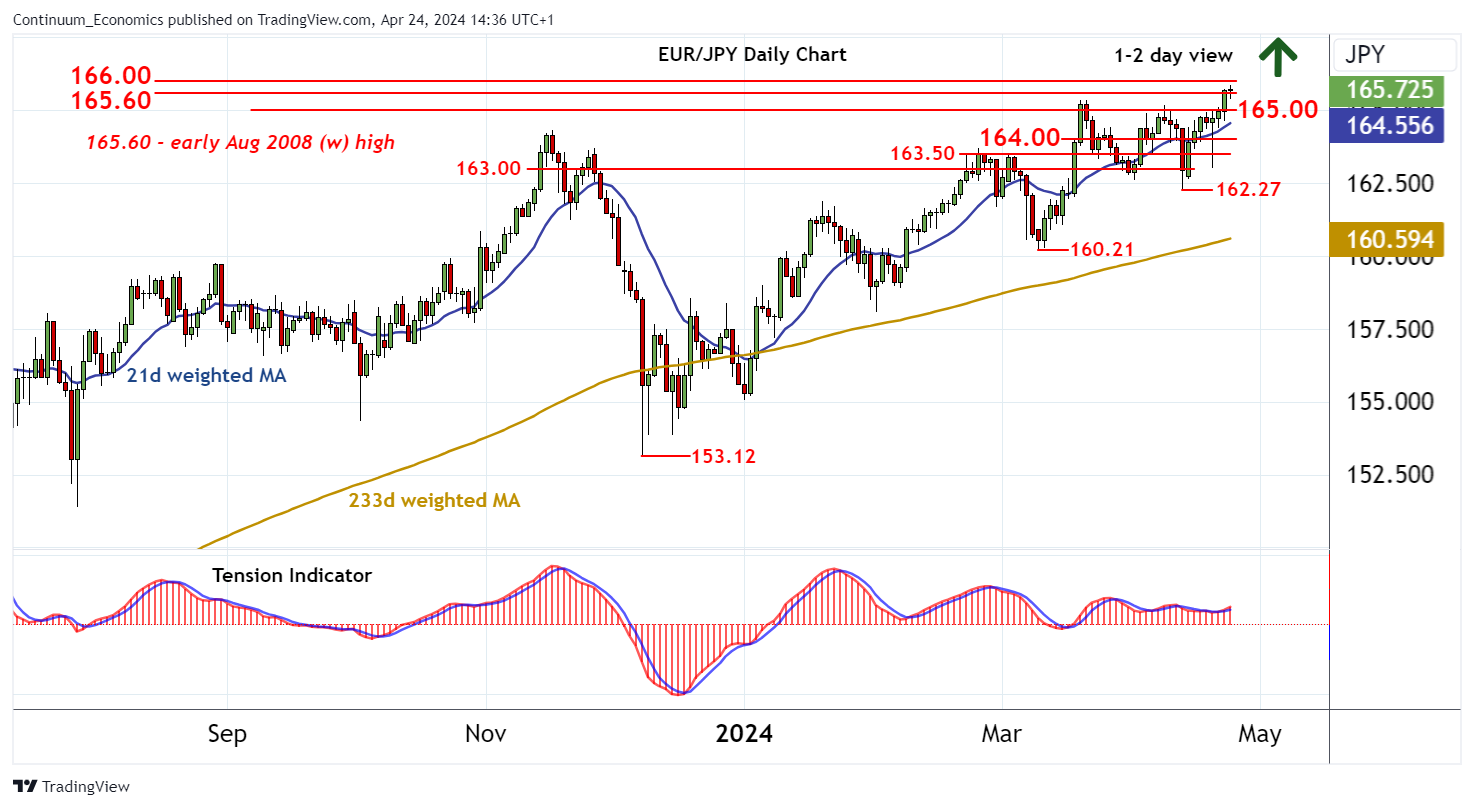
Chart EUR/JPY Update: Trading at August 2008 levels

Senior Technical Strategist
-
Little change, as mixed intraday studies turn near-term sentiment cautious
| Levels | Imp | Comment | Levels | Imp | Comment | |||
|---|---|---|---|---|---|---|---|---|
| R4 | 168.00 | * | congestion | S1 | 165.35/00 | * | Mar high, congestion | |
| R3 | 166.85 | * | 5 Aug 2008 low | S2 | 164.30 | * | Nov high | |
| R2 | 166.00 | * | figure | S3 | 163.70 | * | Feb high | |
| R1 | 165.60 | ** | early Aug 2008 (w) high | S4 | 163.00 | figure |
Asterisk denotes strength of level
14:30 BST - Little change, as mixed intraday studies turn near-term sentiment cautious and prompt consolidation within strong resistance at 165.60 - 166.00. Daily readings have ticked higher, highlighting room for extension of the broad bull trend from the 2012 low towards the 166.85/167.00 area from August 2008. Beyond this, but not yet seen tested, is the 168.00 level. Meanwhile, support remains down to 165.00, and should underpin any immediate setbacks.